
bsbl.io
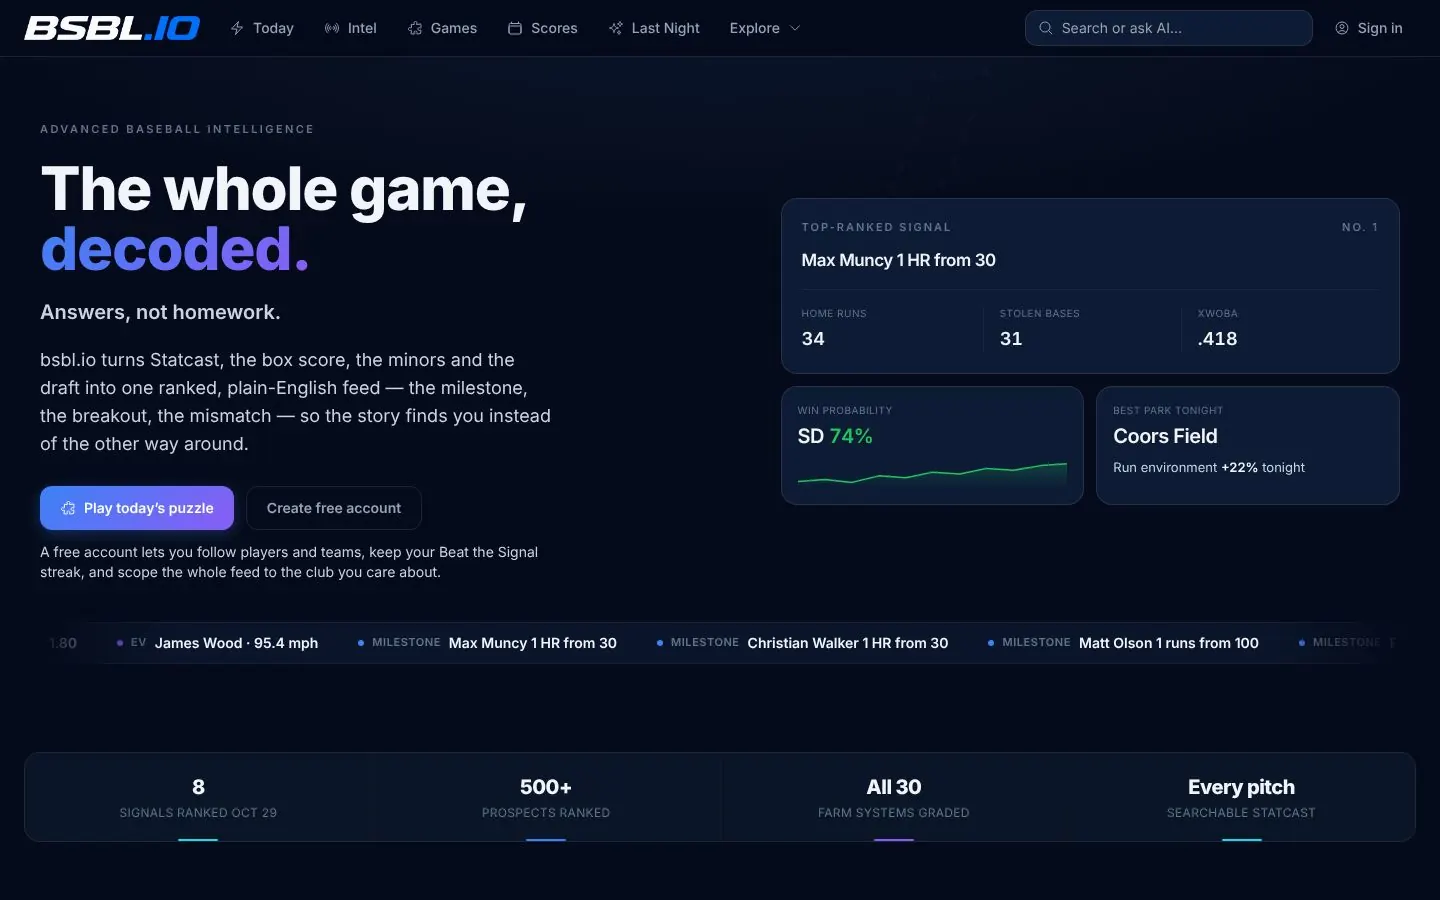
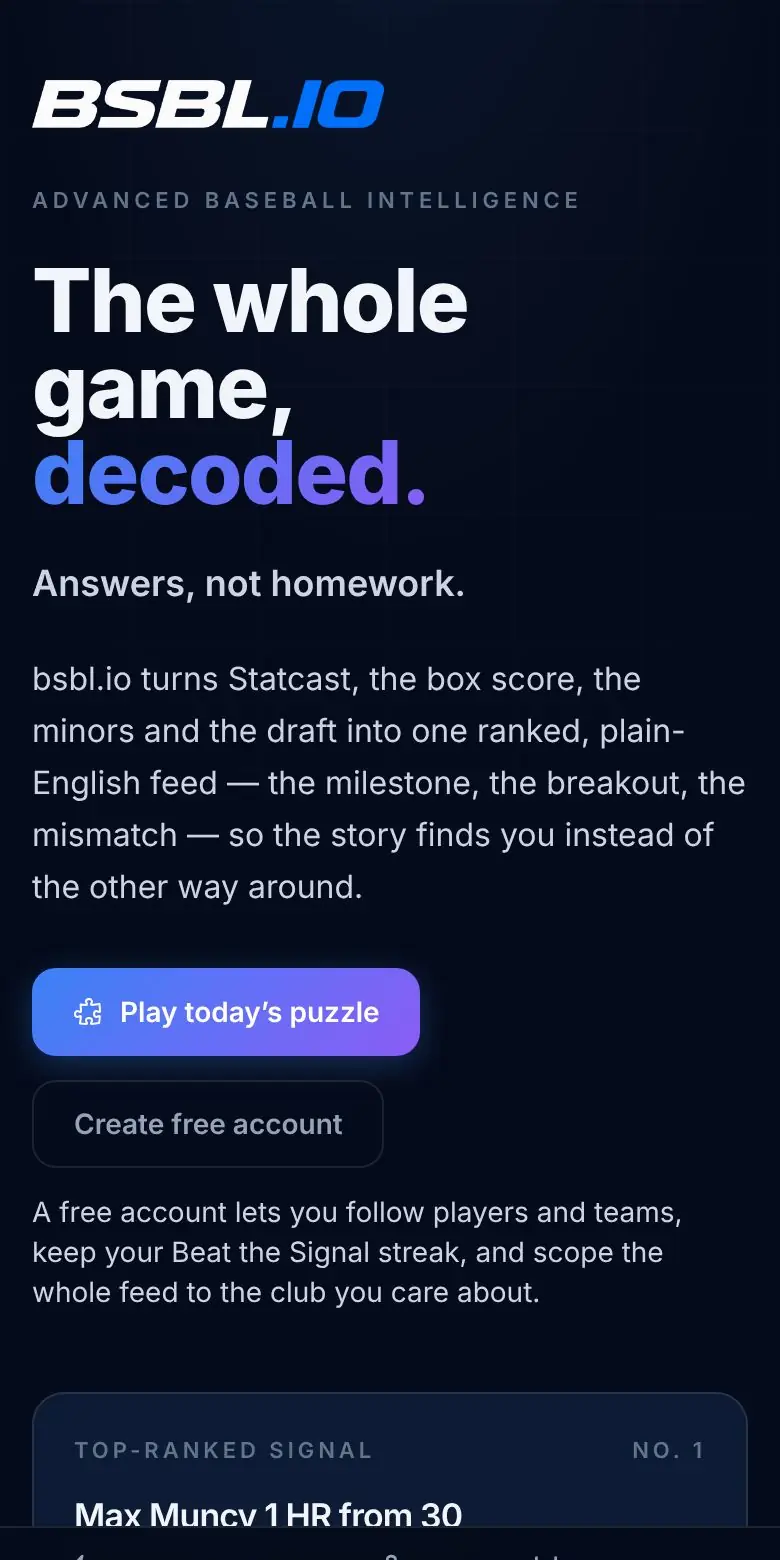
Baseball has more public data than anyone can read. bsbl.io ranks it into one plain-English feed (the milestone, the breakout, the mismatch) so the story finds you.
The problem
Baseball is the most measured sport there is. Every pitch is tracked by Statcast, every minor-league game has a box score, and sites like Baseball Savant and FanGraphs publish more numbers than any fan can keep up with. The data isn't the hard part. Knowing what's worth looking at is.
Most stats sites give you a table and expect you to find the story yourself. I wanted the opposite: "answers, not homework." One feed that watches all of it, ranks what's genuinely unusual, says it in plain English, and lets you ask follow-up questions in your own words.
bsbl.io is a personal research project. It isn't advertised or monetized, and it's where I work through ideas about data pipelines, ranking and applied AI on a dataset I care about.
My role
Everything, end to end: the product, the data model, the ingest pipeline, the signal and scoring logic, the front end, the AI features, and the copy, including a plain-English glossary of every stat the site uses.
It's built across two repositories, a React front end and a Python back end, with about 1,280 commits between March and October 2026. I built it with Claude Code as my pair programmer: I set the direction and reviewed the changes, and the work is backed by more than 3,400 automated tests.
Stack
Front end
A JavaScript single-page app with 61 pages, tested with Vitest.
Data pipeline
26 scheduled jobs pull from the MLB Stats API, Baseball Savant, FanGraphs, Open-Meteo weather and MLB.com news.
Database
More than 100 SQL migrations, plus precomputed tables so pages load fast.
AI
Ask AI plans with Haiku and writes its analysis with Sonnet. The pipeline also uses Claude to write daily facts, under strict number checks.
Hosting
23 functions (Ask AI, an allowlisted data layer, 17 social-card renderers) and 10 edge functions for link previews.
Architecture
Claude never writes database queries. It chooses from fixed, tested data sources and chart types, and every answer is built from rows the system actually fetched. Each question's outcome is logged without any user, session or IP data and deleted after 90 days.
Key features
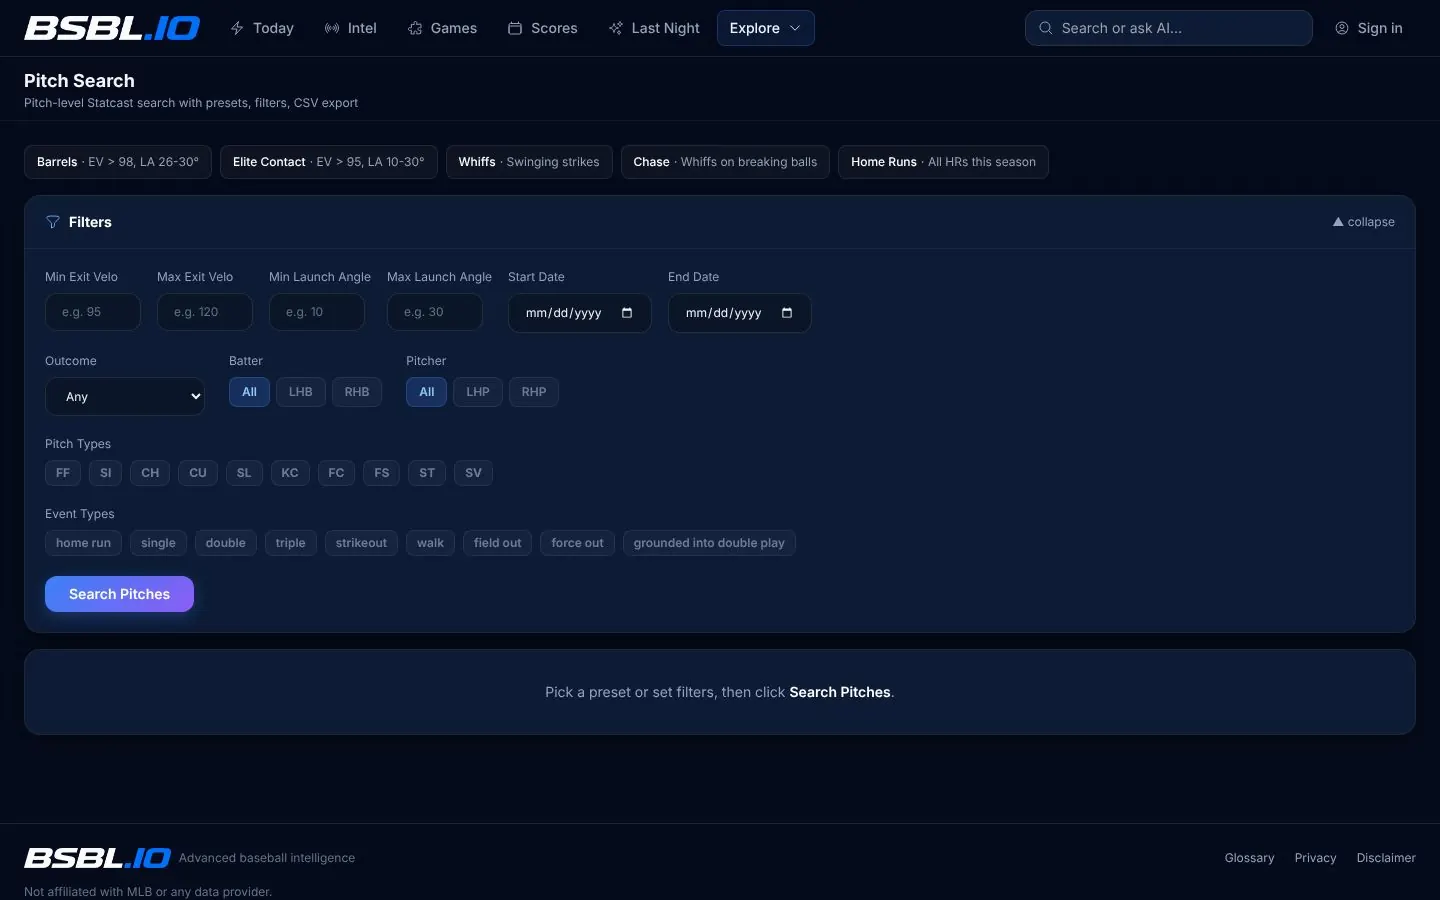
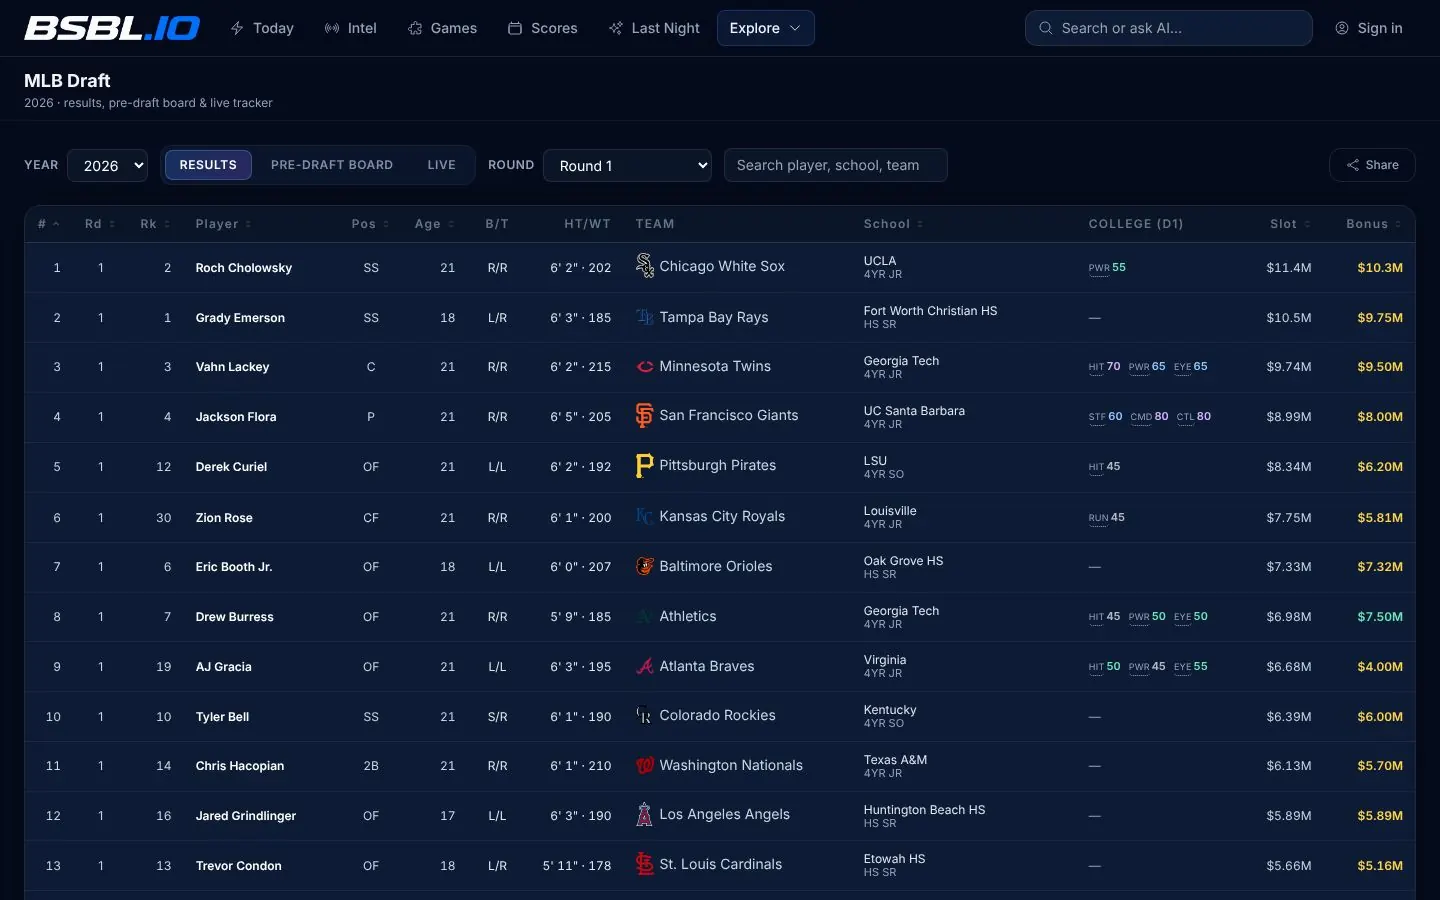
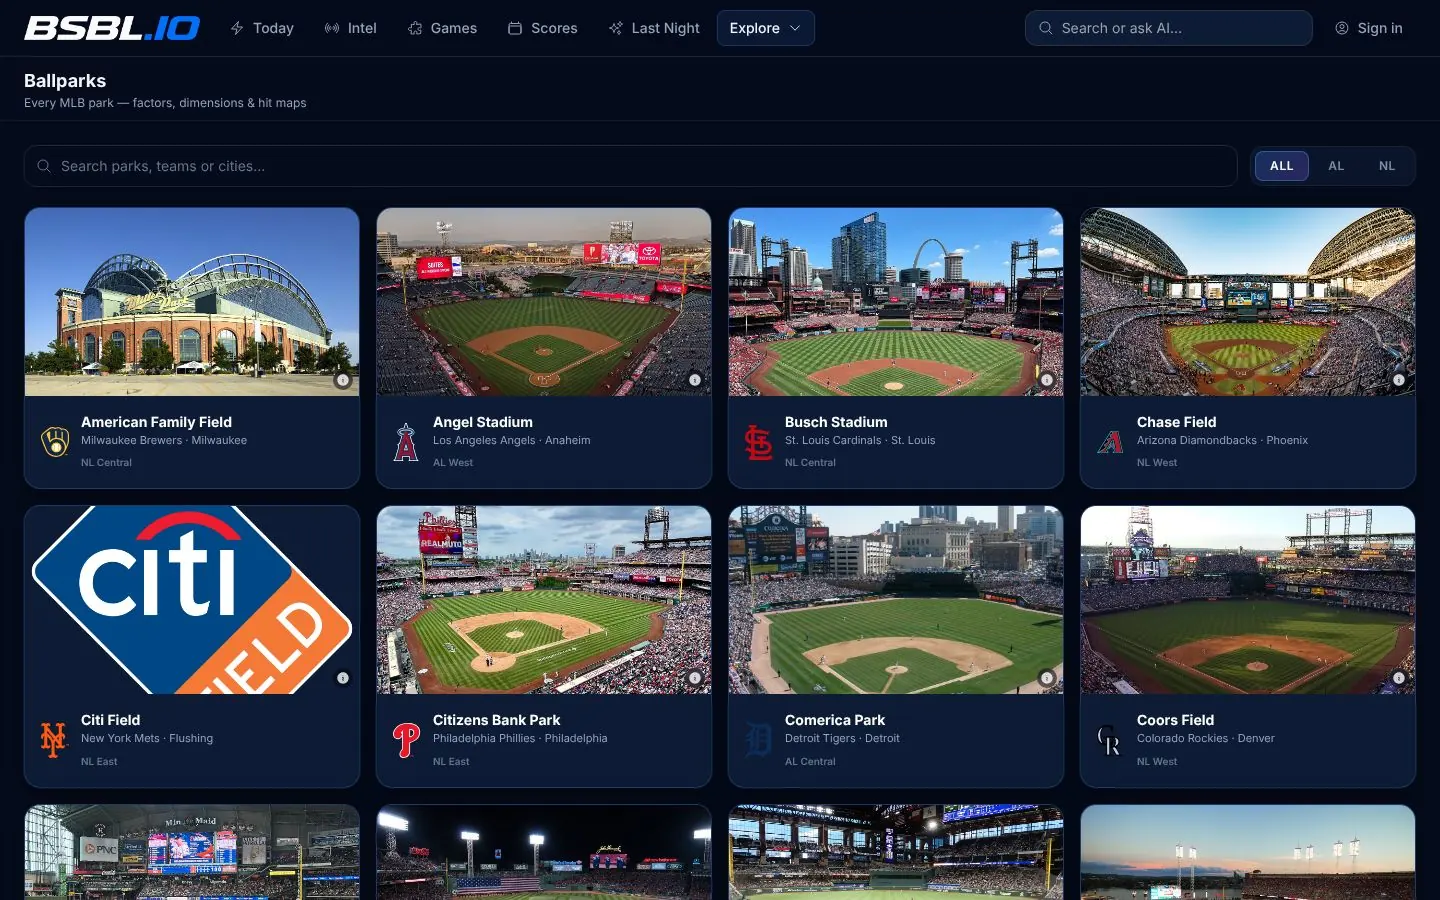
- Ask AIAsk any baseball question in plain English. Claude picks the data source and the chart, and the answer comes from real rows.
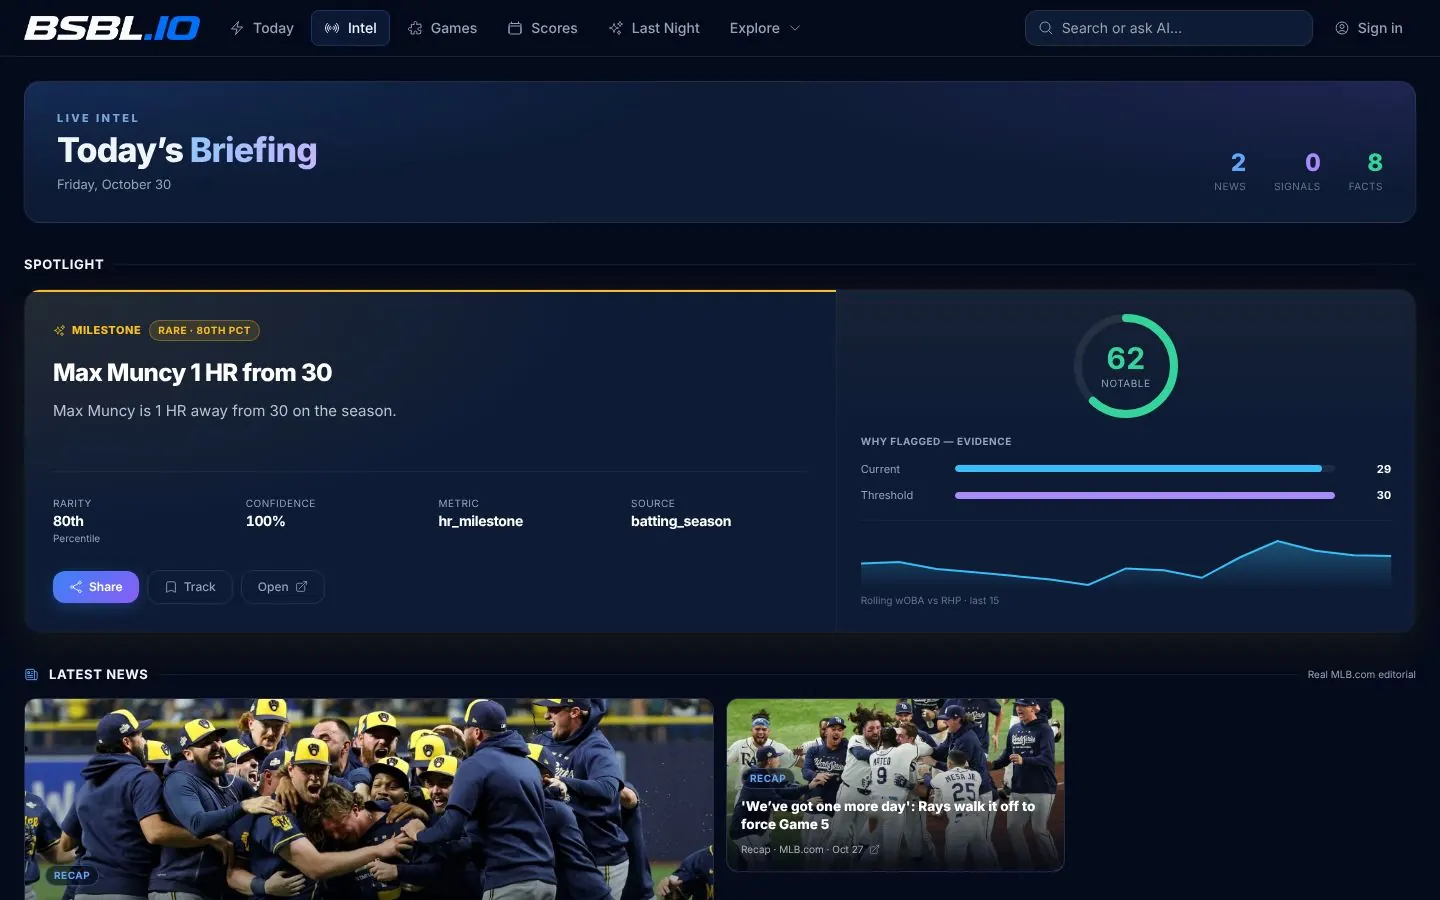
- Ranked signalsBreakouts, regressions, streaks, splits, matchups, milestones and anomalies, scored and ranked into one feed.
- Org developmentAll 30 farm systems graded on farm development and MLB outcomes, plotted against each other.
- Two daily gamesSpray (guess the hitter from his spray chart) and Beat the Signal (pick a hitter to get a hit, then build a streak).
- Matchup Lab and CompareScout any batter against any pitcher, or line up four players head to head and get a verdict, not just a table.
- A 243-term glossaryEvery stat code in the app links to a plain-English definition, with formulas and typical ranges where they apply.
Hard problems
Ranking "interesting" without crying wolf
A feed that flags everything is as useless as one that flags nothing. Every candidate, from a milestone to a slump signal, is scored on a transparent weighted blend, and only rows above a threshold publish.
A type that keeps showing up day after day is damped a little each day, so the top of the feed stays genuinely unusual, and every item keeps the evidence behind it so it can be checked.
WEIGHTS = {
    "rarity_score": 0.25,
    "relevance_score": 0.20,
    "recency_score": 0.15,
    "magnitude_score": 0.15,
    "weirdness_score": 0.15,
    "narrative_score": 0.10,
}
AI that can't make numbers up
An LLM will happily write a confident, wrong number. When Claude writes a daily fact, every number in its headline and context is checked against the stats it was given. One number that isn't in the source and the row is held back instead of published.
Ask AI follows the same rule: Claude plans from fixed data sources and chart types, and anything it gets wrong is repaired or refused. Logging every outcome is how a silent failure surfaced: structured output had been dropped on every query for weeks because the schema had grown past the API's limits. The fix was to restructure how parameters are sent.
# Guardrail: reject AI-introduced numbers.
for field in ("headline", "short_context", "why_it_matters"):
    bad = _ungrounded_number(out.get(field, ""), grounded)
    if bad is not None:
        row["do_not_publish_reason"] = (
            f"AI introduced ungrounded number {bad} in {field}")
        row["status"] = "candidate"
        return row
Millions of pitch rows without timeouts
As the pitch table grew past eight million rows, offset paging got slower with every page and jobs started hitting their time limits. Reads now go one day at a time, in a stable order, with retries.
The public sources rate-limit and fail. Each host gets backoff with jitter and a circuit breaker that pauses for 30 minutes after five blocked requests in a row, and the history backfill runs one season at a time.
rows = (supabase.table("statcast_pitches")
        .select(cols_str)
        .gte("game_date", day.isoformat())
        .lt("game_date", next_day.isoformat())
        .order("game_date")
        .order("id")
        .range(offset, offset + page_size - 1)
        .execute()
        .data or [])
The January 1st bug
On New Year's Day the nightly sync started loading "the 2027 season", found nothing, and reported success. Nothing looked broken, but nothing was updating. The season now comes from a real season calendar, and an off-season policy throttles about 15 daily jobs in winter so empty runs don't hide real failures.
as_of = as_of or date.today()
by_calendar = as_of.year if season_has_started(as_of) else as_of.year - 1By the numbers
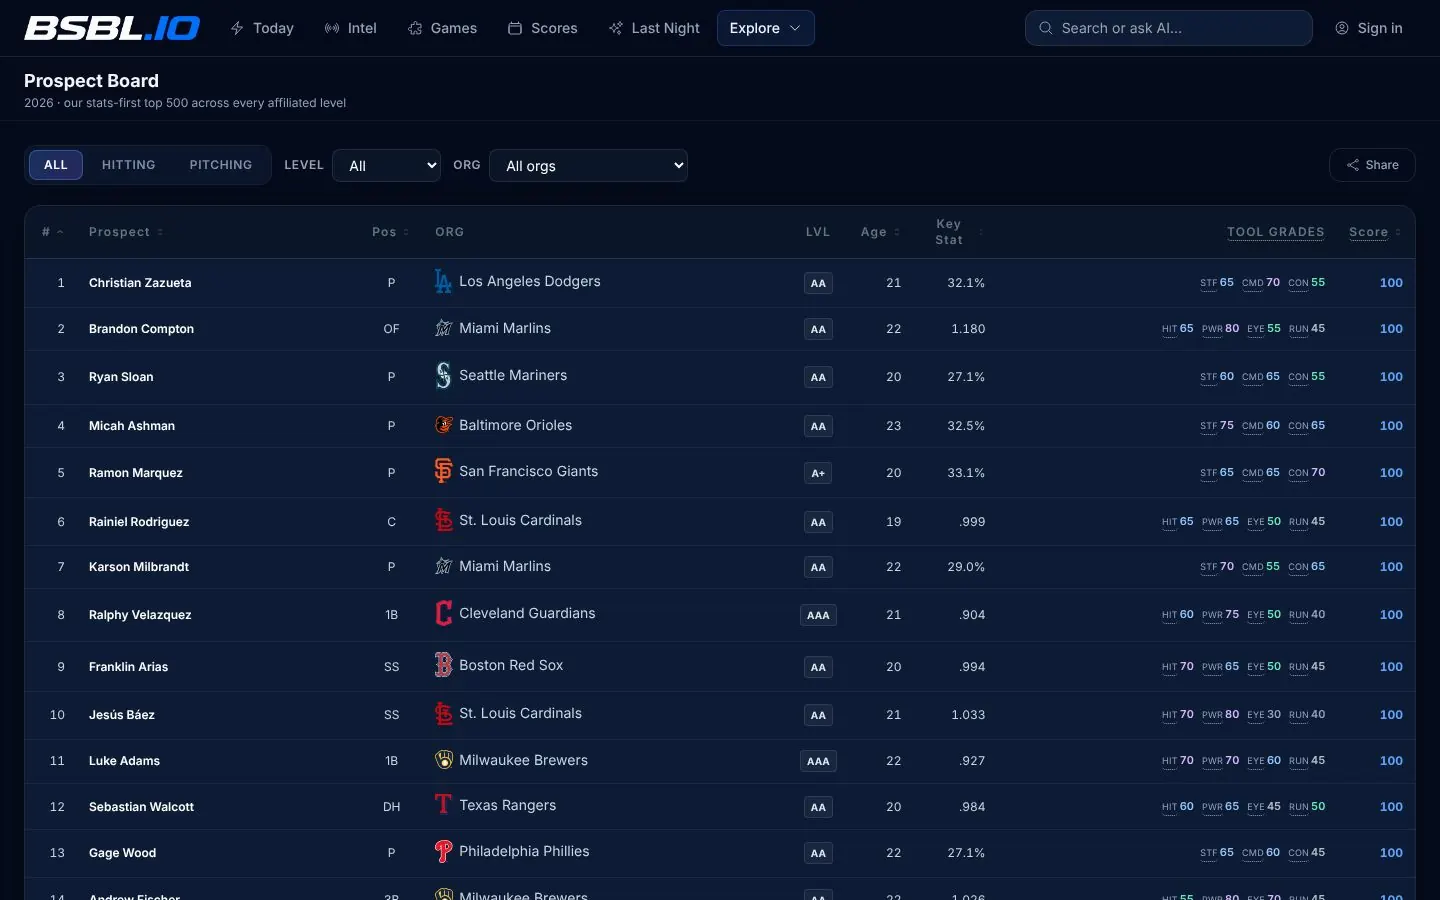
bsbl.io is live and updates through the season, including the postseason: 61 pages, a 500-player prospect board, draft classes back to 2015 and a 243-term glossary. It's the project where I push hardest on the things clients ask me about most: pulling messy public data into one reliable model, ranking it so people see what matters, and putting AI on top in a way that stays honest about the numbers.
Sitting on data nobody has time to read?
I build pipelines, rankings and AI features that turn raw data into answers your team can act on.
Let's talk →Visit bsbl.io ↗